
Board Game Bonanza: Data Collection and Wrangling
A short tutorial explaining how to collect and clean data relating to board games.
Everyone loves a good board game. Board games bring people together, offer intellectual stimulation, and provide a form of entertainment that is not tied to a screen. But what makes a board game popular?
To explore this question, first we need to find data on popular board games. We’ll use python to collect, explore, and clean this data.
Data Source
One great source of board game data is BoardGameGeek. This website is an online database and community for those who love board games. Not only does it have information about hundreds and thousands of board and card games, but it also allows users to rate and sell board games on the website. Because of this, we can find data about each board game’s requirements, it’s popularity, and it’s value.
BoardGameGeek offers an API that allows the user to access data on a game by game basis. Before accessing the API, it’s best to check the Terms of Service. The good news is that we are able to use this data for non-commercial use. We just need to credit Board Games Geek by including its logo in public facing uses of the API.
So all credit for this data is given to BoardGameGeek. Here is their logo:

Accessing the API
Board Game Geek has an explanation of their API.
To access the data for each board game, we need the base url, the endpoint, parameters (set the id of the game and whether to show stats and marketplace data).
baseurl = "https://boardgamegeek.com/xmlapi2"
endpoint = "/thing?id="
parameter1 = str(ids[0])
parameter2 = "&stats=1&marketplace=1"
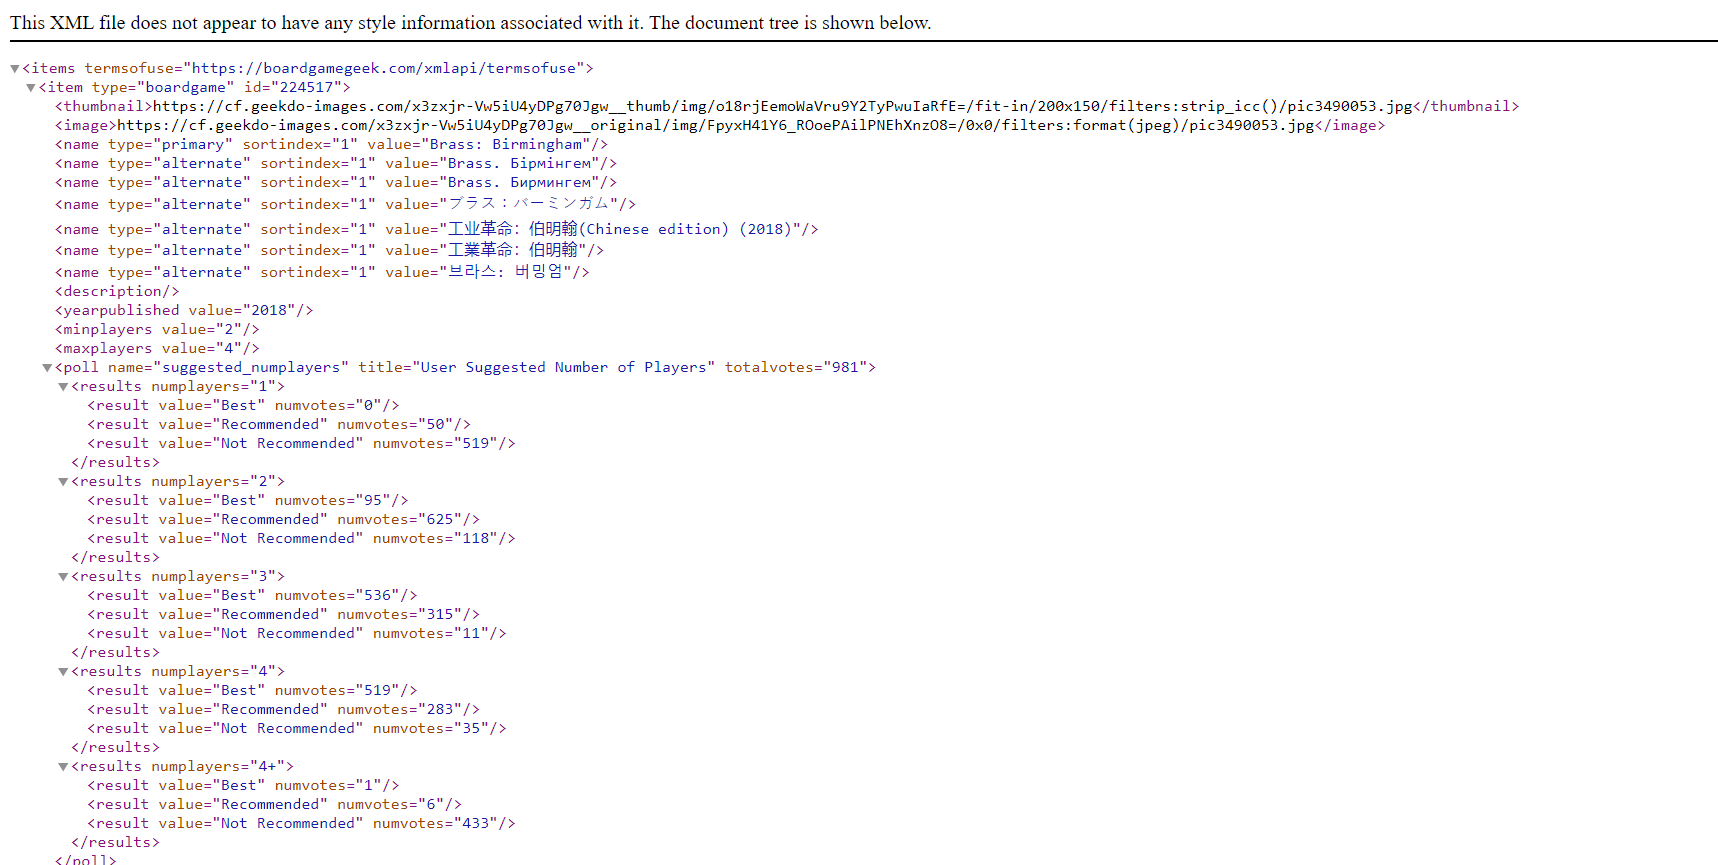
Each API pull will result in an XML file, that looks a little like this:
Prepping the API pull
Because each API pull does not result in all the board game data, but the data for one board game, we need to set up a process to pull data for all the board games we want. To do this, we need the IDs for each board game we want to pull. Luckily, on the API explanation page, BGG provides a csv file with data on every board game. Unfortuantely, this does not include much of the data we want, but we can use this csv for IDs of board games to pull.
To download the .csv file, you need to make an account with BGG. Once you have an account, you can download this file from the API explanation page.
Import the following packages:
import pandas as pd
import numpy as np
import requests
import re
import urllib.parse
import matplotlib.pyplot as plt
import seaborn as sns
from bs4 import BeautifulSoup
import time
Next, read in the board games .csv file and select the IDs you want to use. I used the first 1000 IDs because it is a time consuming process:
## Get Board game IDs from csv file provided by boardgamegeek.com
ids = pd.read_csv("boardgames_ranks.csv")
#Select top 1000
ids = ids["id"]
ids = ids[0:1000]
Then set up portions of the API url using the code referenced above:
baseurl = "https://boardgamegeek.com/xmlapi2"
endpoint = "/thing?id="
parameter1 = str(ids[0])
parameter2 = "&stats=1&marketplace=1"
Initialize the data fields
Then initialize the data fields we want. These include the board game name, the year it was released, minimum number of players, maximum number of players, the estimated playing time, the minimum age, the number of accessories, the number of users who gave a rating, the average rating, the Bayes rating (which is the average rating with 30 average ratings tacked on to prevent new board games with high ratings from taking over rankings), the standard deviation of the ratings, and the average USD price of games selling in the marketplace as of November 12.
name = []
yearpublished = []
minplayers = []
maxplayers = []
playingtime = []
minage = []
accessory_num = []
users_rated = []
averagescore = []
bayesaveragescore = []
stddev = []
avg_USD_price = []
Pulling and scraping the data
Finally, we need to loop through our list of IDs to pull the XML file for each board game, and pull the data we want from the XML file. A for loop is not the most time effective, but it was the best way I could think of to pull the API for each ID. Notice that there is a request delay of 10 seconds so requests don’t get throttled. For the most part, this code uses Beautiful Soup to pull much of the data. USD price data is calulated by summing up all the listings in USD dollars and then dividing it by the number of listings. Warning: This takes a long time to run. I only pulled the top 1000 rated games because of the time it took to pull this data.
for x in range(0,len(ids)):
    parameter1 = str(ids[x])
    time.sleep(10) #so that requests don't get throttled
    url = baseurl + endpoint + parameter1 + parameter2
    r = requests.get(url)
    if r.status_code == 429: #to prevent going on with the code when request is denied for too much traffic
        time.sleep(10)
        r = requests.get(url)
    if r.status_code == 429:
        time.sleep(10)
        r = requests.get(url)
    soup = BeautifulSoup(r.content, "xml")
    name.append(soup.find("name")["value"])
    yearpublished.append(soup.find("yearpublished")["value"])
    minplayers.append(soup.find("minplayers")["value"])
    maxplayers.append(soup.find("maxplayers")["value"])
    playingtime.append(soup.find("playingtime")["value"])
    minage.append(soup.find("minage")["value"])
    accessory_num.append(len(soup.find_all("link", type="boardgameaccessory")))
    users_rated.append(soup.find("usersrated")["value"])
    averagescore.append(soup.find("average")["value"])
    stddev.append(soup.find("stddev")["value"])
    bayesaveragescore.append(soup.find("bayesaverage")["value"])
    usd_prices = [float(item["value"]) for item in soup.find_all("price", currency = "USD")]
    if len(usd_prices) == 0:
        avg_USD_price.append(None)
    else:
        avg_USD_price.append(sum(usd_prices)/len(usd_prices))
Finally, we can create a data frame from all these lists.
boardGames = pd.DataFrame({"Title": name, "Year Published": yearpublished, "Min Players": minplayers, "Max Players": maxplayers, "Playing Time": playingtime, "Age Minimum": minage, "Number of Accessories": accessory_num, "Number of Ratings": users_rated, "Average Rating": averagescore, "Bayes Rating": bayesaveragescore, "Standard Deviation": stddev, "Average USD Price": avg_USD_price})
boardGames.to_csv("boardgamesdata.csv")
Data Cleaning and Engineering
The data now needs to be cleaned and engineered.
- Create the new variable of age of game (by subtracting the year published from 2023, the year the data was pulled), change the playing time variable to be an integer, and set the other numeric columns to be numeric.
boardGames["Age (Years)"] = 2023 - boardGames["Year Published"].astype(int) boardGames["Playing Time"] = boardGames["Playing Time"].astype(int) num_cols = ["Year Published", "Min Players", "Max Players", "Age Minimum", "Number of Accessories", "Number of Ratings", "Average Rating", "Bayes Rating", "Standard Deviation", "Average USD Price"] boardGames[num_cols] = boardGames[num_cols].apply(pd.to_numeric) - Create categories for estimated playing time, recommended minimum age, and maximum playing group. We can do this by using pandas cut function, which assigns numeric values to labelled bins you determine.
boardGames["Time Category"] = pd.cut(boardGames["Playing Time"], bins=[0,31,61,91,181,301,1501], labels = ["Quick", "Short", "Moderate", "Long", "Very Long", "Marathon"])
boardGames["AgeRating"] = pd.cut(boardGames["Age Minimum"], bins=[0,5,8,12,16,24], labels = ["Any", "Young", "PreTeen", "Teen", "Adult"])
boardGames["GroupSize"] = pd.cut(boardGames["Max Players"], bins=[0, 1, 4, 8, 101], labels = ["Individual", "Small", "Large", "Massive"])
boardGames.to_csv("boardgamesdata.csv", index = False)
The first five rows of the resulting data frame should look something like this:
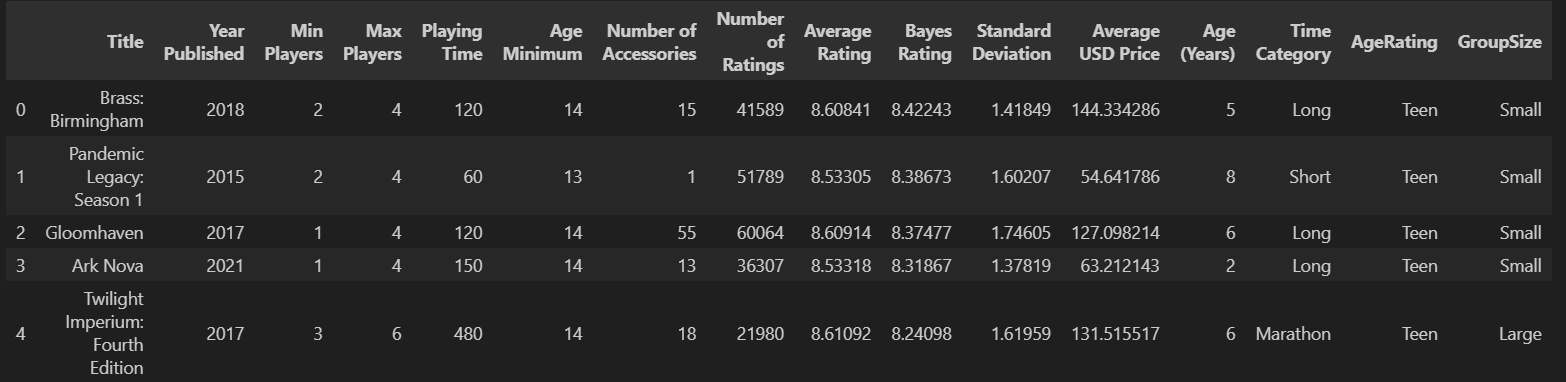
Congratulations! We now have data for the top 1000 board games that we can now explore. In the next article, we’ll explore this data to find what features these popular board games share.
Visit my repository for the data and jupyter notebook to replicate this process.