
Board Game Bonanza: EDA
An exploration of the top 1000 rated board games.
In a previous post, I showed how we can collect data to find what makes a board game popular. In this post, we’ll use python to explore that data.
As a reminder, all data comes from BoardGamesGeek!

What is in our data?
As you might remember from the previous post, this data consists of the top 1000 rated games on BoardGameGeek. The data also includes different variables about each board game, including year, age recommendations, estimated time, ratings, average price, etc.
Because this is the top 1000 board games and not all the board games (due to time constraints), we can’t draw any specific conclusions about what makes a board game highly rated (since this iis a biased sample). However, we can still make some interesting observations.
Distributions of Variables
What are the distributional breakdowns of each factor in our data? What outliers are interesting?
To answer these questions, let’s take a look at the distributions of our data. This first figure shows the histograms for our three categorical variables: group size, length of time, and age rating.
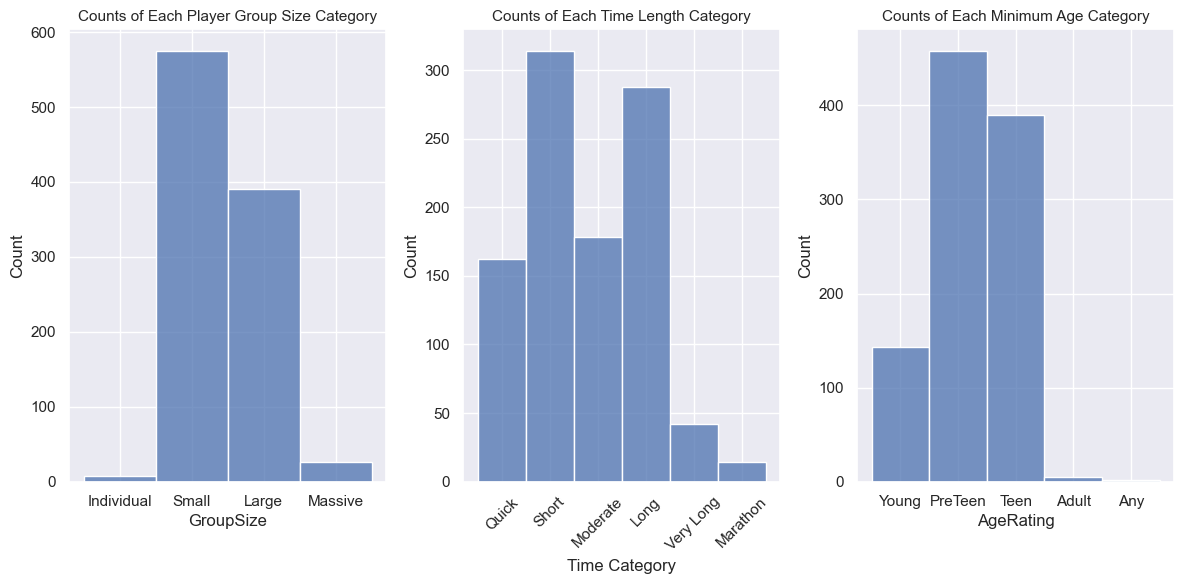
The vast majority of these top 1000 games are in the center of these 3 groups: Small - Large groups (but not too small or too large), short to long (but not quick or too long), and are rated for preteeens and teens (not too young but not too adult either). Whether this is because there are just more of games with these factors in general, or because these receive higher ratings is the question that can only be answered by looking at more data.
We will also take a look at the distributions of our numerical data. Unfortunately, some of these graphs are impacted by outliers:
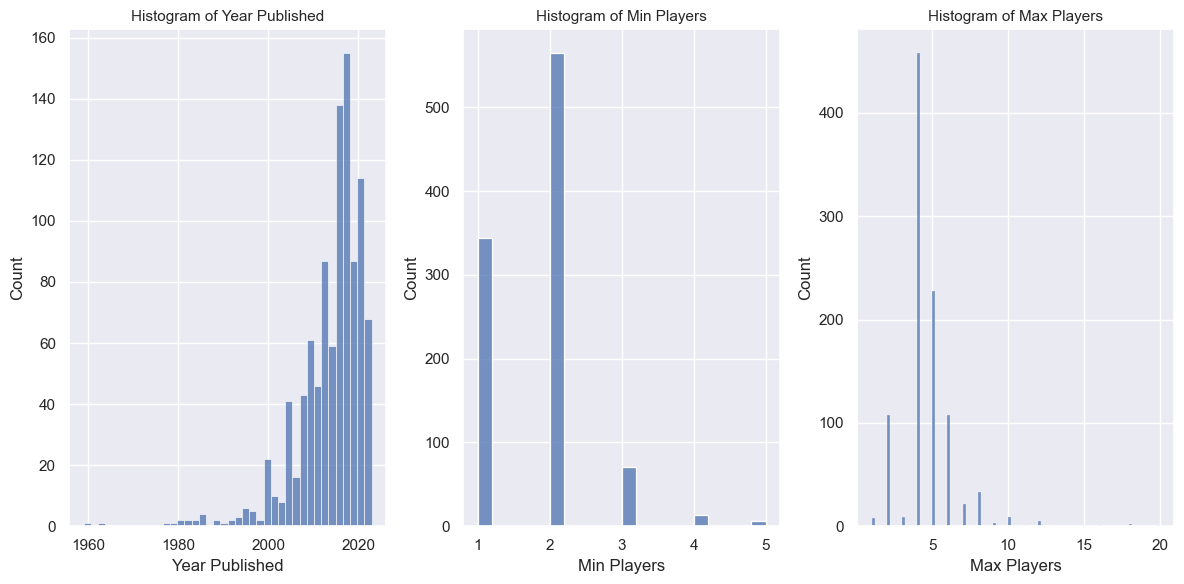
I adjusted these graphs to account for outliers:
- I changed the year published distribution to leave out the 6 games that are pre-1950 (one game, Go, was from 2000 B.C.E. which made it difficult to see the graph).
- I removed the 4 games that have max players of 99-100 players.
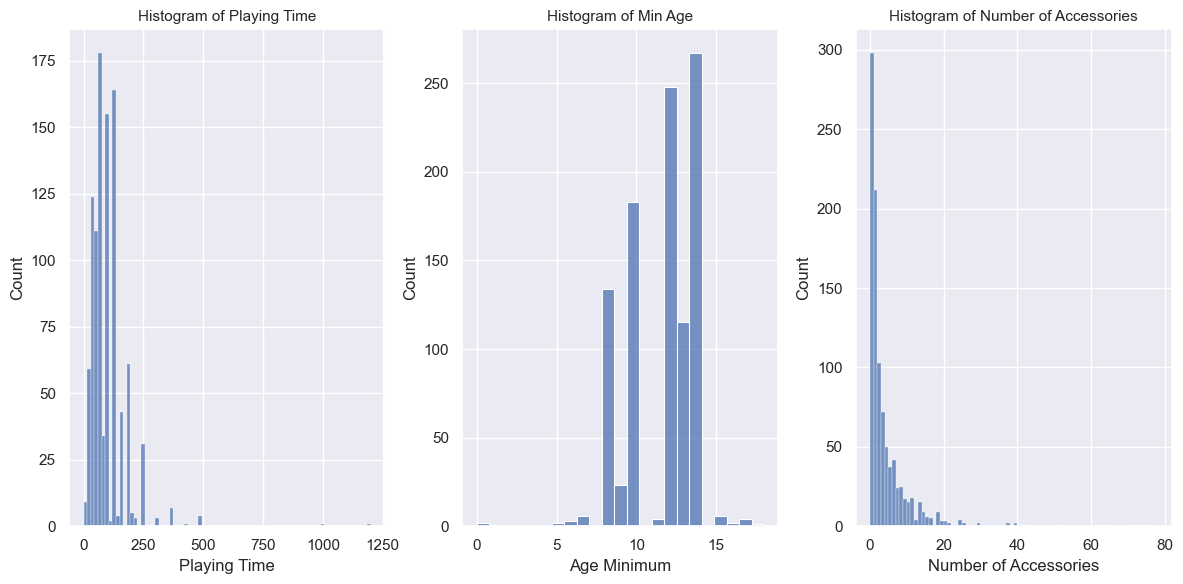
- For the distribution of playing times, I removed two games with a playing time of 20 hours. T
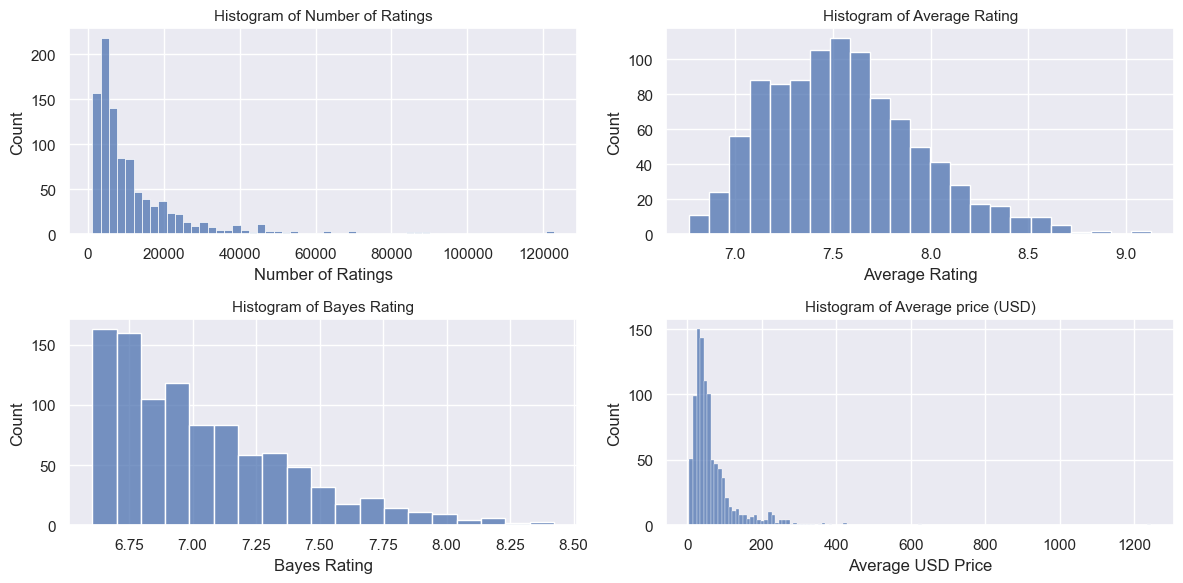
- he Average Price distribution has “Magic: The Gathering” left out, because it has an average price in the $7000s (probably due to the rarity of some cards).
- There are some other outliers I left in; for example, there are 11 games with over 80,000 ratings. But I removed the outliers that made the graphs difficult to see, and I wanted to note them because they are different than the vast majority of the games.
Some of my takeaways for these distributions and what they tell us about the most popular 1000 games:
- The most popular games are all pretty recent; the median age is 8 years old, or around 2015.
- It seems the most common number of players range is 2-4 players.
- The median playing time is an hour and 15 minutes and the median age minimum is 12 years old.
- While these games are sorted by top 1000 games by Bayes Rating, the better measure of popularity is number of ratings, which is the best indicator of whether someone played it.
Correlation of Variables
How are different variables related? And which variable relationshps should we ignore?
To answer these questions, let’s take a look at how the variables are all related through a correlation plot.
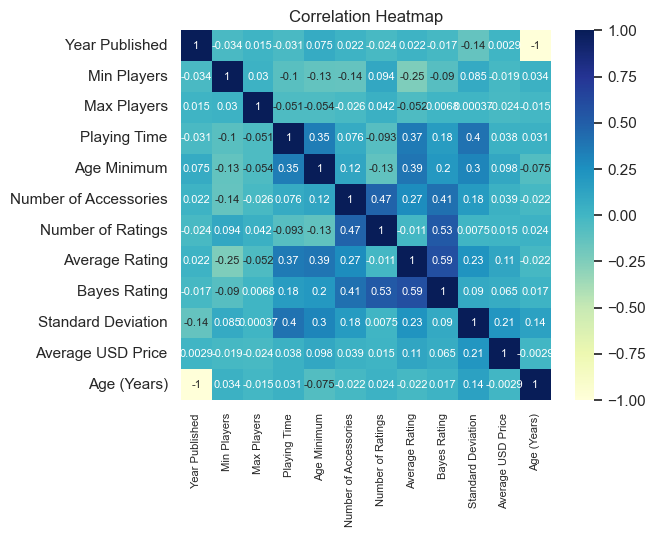
My biggest takeaways from this figure:
- First is what to ignore: Bayes and Average Rating are highly correlated, which makes sense because they are the same except for an additional 30 average ratings for the Bayes rating. When performing analysis, it is best to ignore one of these values to avoid covariance.
- As well, ignore the correlation between Age and Year Published; because one is a function of the other, these will always be perfectly negatively correlated.
- “Number of Ratings” and “Number of Accessories” are pretty moderately correlated. Perhaps the more expansions and versions of a game, the more opportunities a person has to play the game and the more likely they are to rate the game.
- There is a moderately high correlation between the variance of ratings and the amount of playing time a game requires; since a higher variance indicates a greater spread of opinion, this seems to show that the longer a game takes, the more ploarizing a game becomes.
- There’s an interesting slight negative correlation between number of ratings and average price. My prediction is that the more popular a game is, the more games there are which lowers the price. It’s the games that are a little rarer but still have a devoted fanbase that are likely more expensive, wwhich is backed up by the fact that price and average rating are more highly correlated than price and Bayes rating (less ratings means the generic ratings in a Bayes Rating are weighted more heavily).
- The minimum number of players has a very small correlation with the maximum number of players. This is very interesting because I assumed that if there is a smaller minimum, there will likely be a small maximum as well. There could just be noise throwing off the correlation in this case, but there’s enough that makes the correlation near 0.
Distribution of Popularity
How are number of reviews distributed across different factors? Is there any significant difference between their means?
When it comes to our categroical factors, I was interested to see if any of them had an impact on a game’s popularity. I took a look using violin plots:
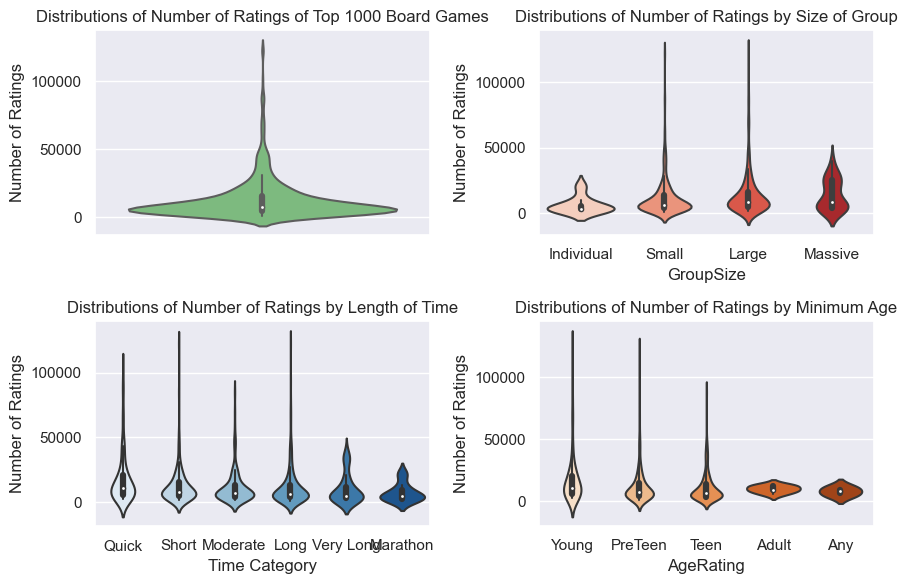
These plots sort of parallel our distributions. That is, the more “central” values of these factors have the highest median number of ratins and the highest maximums (though it doesn’t look like any of these are significantly different from one another). However, there are more popular games in the quick and young categroies than one would expect given their number in the dataset. Perhaps this is tied to people rating games they play, and many people play a lot of games when they were kids. Playing time and age minimum are moderately correlated due to the fact that younger kids have shorter attention spans.
Popularity by Age of Game
How does year published impact popularity? In looking at these top 1000 games, it’s interesting to take a look at how when the game was published impacts the game’s popularity (as measured by number of ratings).
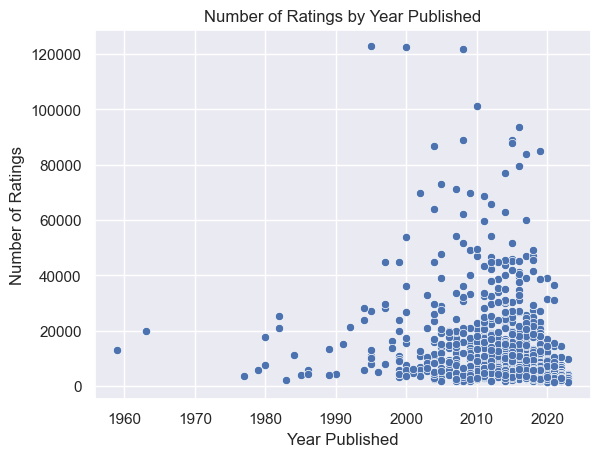
The most popular games were published between 5-20 years ago (with one of the most popular being almost 30 years ago). On one hand, we shouldn’t expect to see any extremely recent games have a lot of ratings, since ratings increase over time. But part of this could also be attributed to who is giving ratings and the response bias this creates.
Conclusion
Unfortunately, this data does not contain all board games, just the top 1000 rated games. Because of this, we have a biased sample and can’t see the composition of lower rated games. However, we can still make some assumptions. From these graphs, it indicates that most highly rated games are similar in basic features. They mainly seem to be in a goldilocks zone of sorts, not too long but not too short, not too many people but not too few, etc.
Take a look at the dashboard I built to explore the data further and see if there are any trends you notice. Send me an email with any further suggestions to explore!
Visit my repository for data and jupyter notebooks to create these graphs.